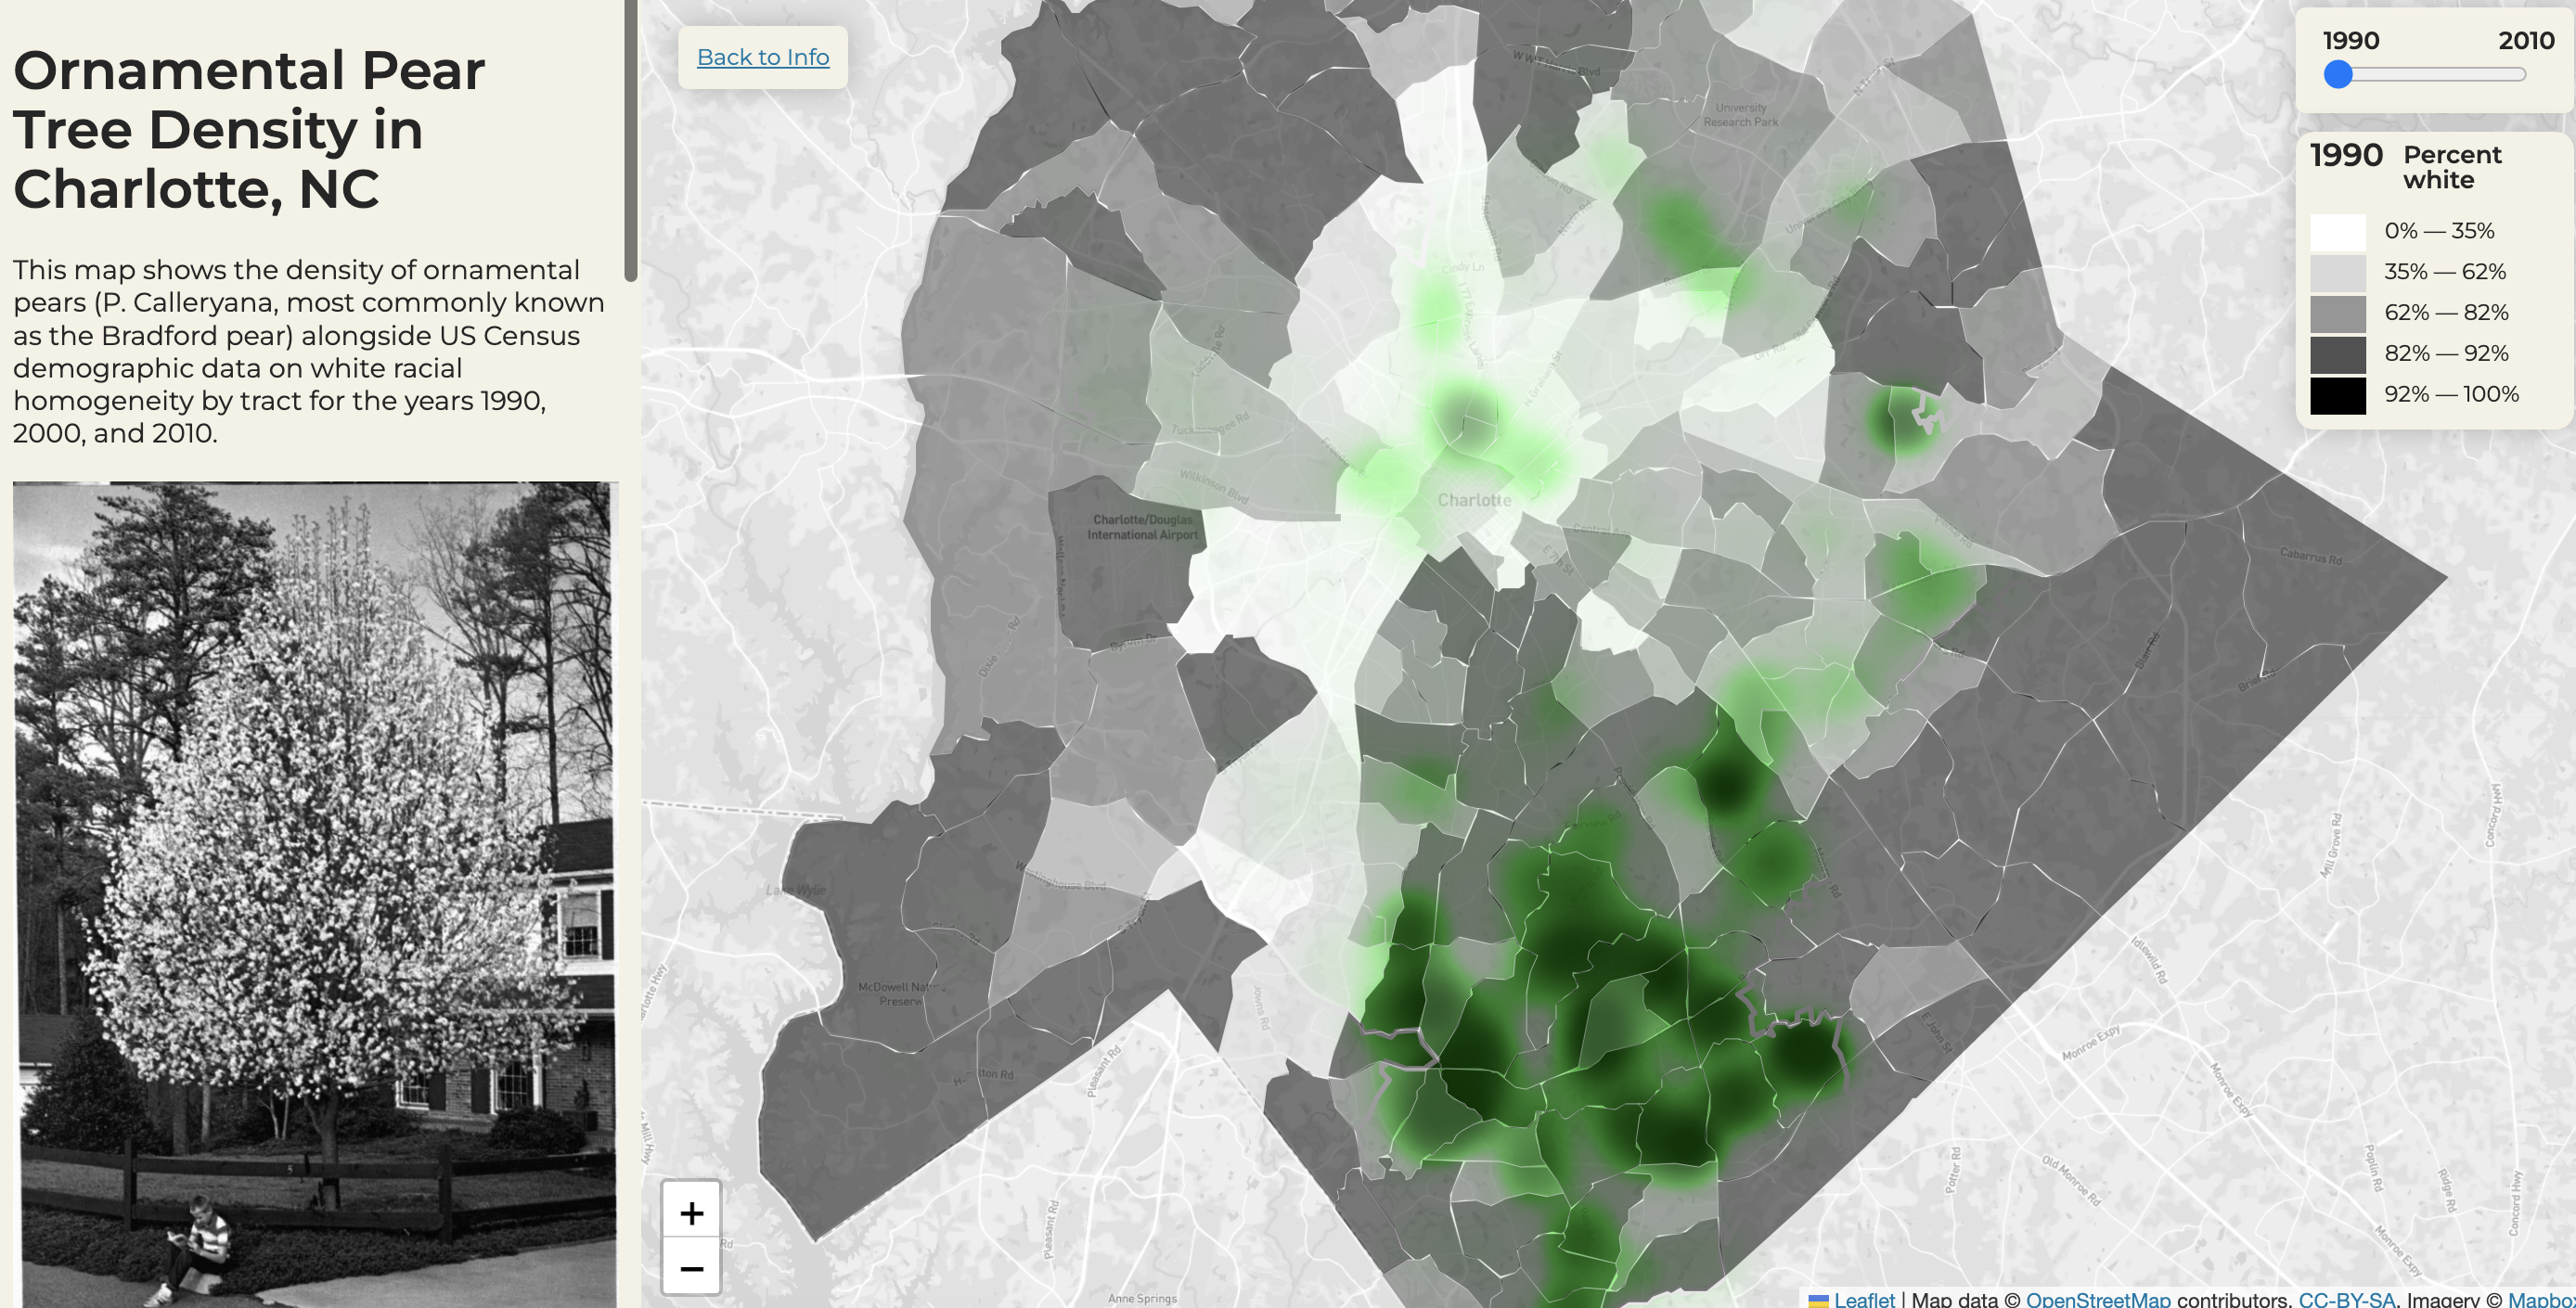
Ornamental Pear Tree Density in Charlotte, NC
Interactive web map based on my master's thesis research on the cultural and historical biogeography of Pyrus calleryana cultivars, trees popularly planted in the southern region during a time of suburbanization. Created with Javascript, Leaflet, chroma.js, leaflet.heat, Bootstrap, and data from the Charlotte urban tree canopy inventory.
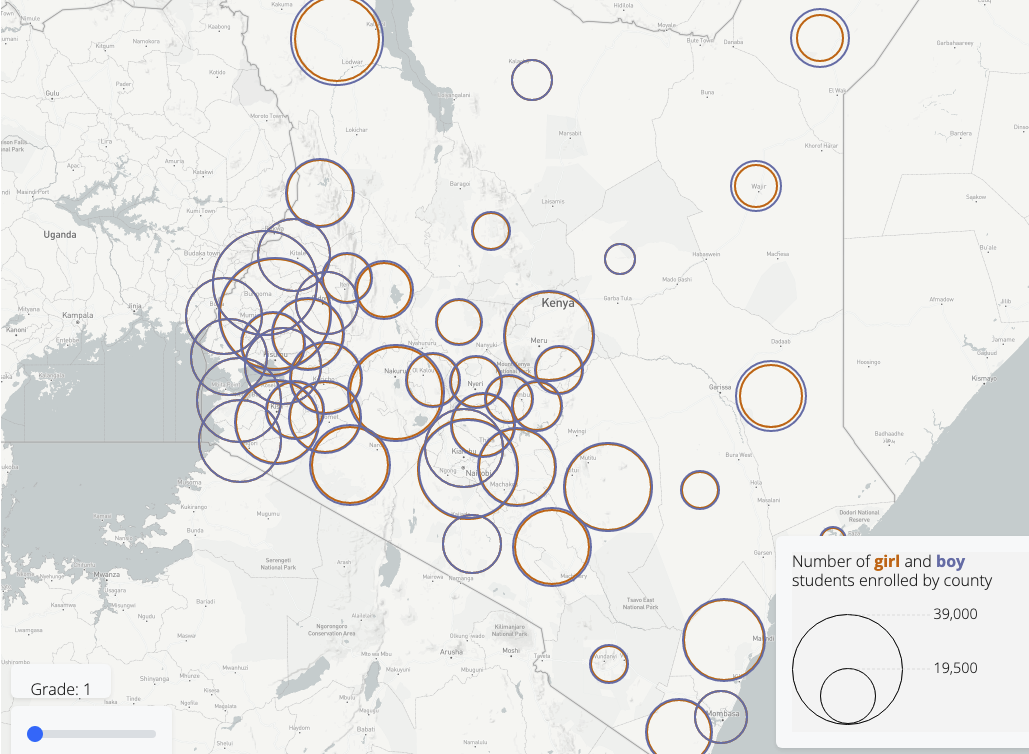
Gender Equity in Kenyan Primary Schools
This interactive web map compares Kenyan primary school enrollments for grades 1-8 by gender for the year 2014 and shows enrollment distributions by county. The map was created with Javascript, Leaflet, and Bootstrap, using data from the Kenya Open Data Portal.
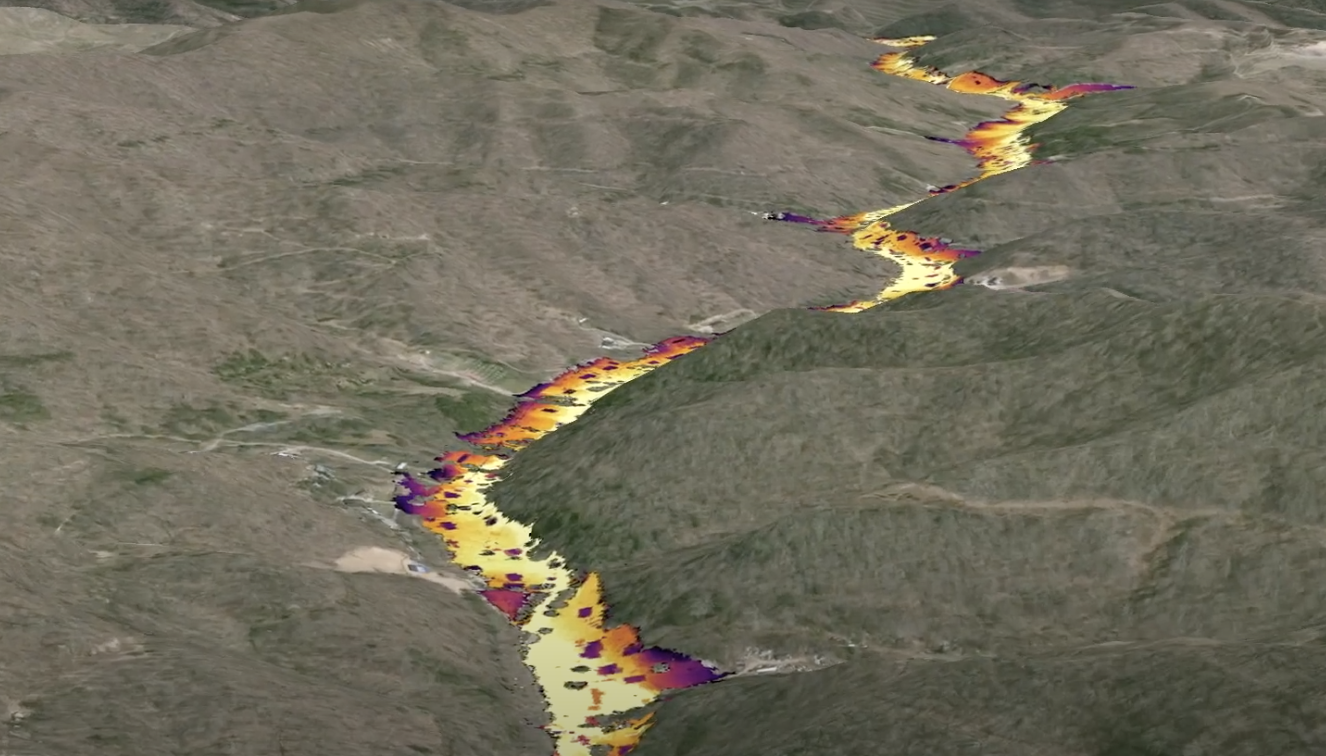
Flood-Prone Infrastructure in Eastern Kentucky
These maps and visualizations analyze flood-prone infrastructure in the Eastern Kentucky watershed of Robinson Creek using ArcGIS Pro and LIDAR data. This work was created for the course GEO509: Workshop in Geospatial Technologies.
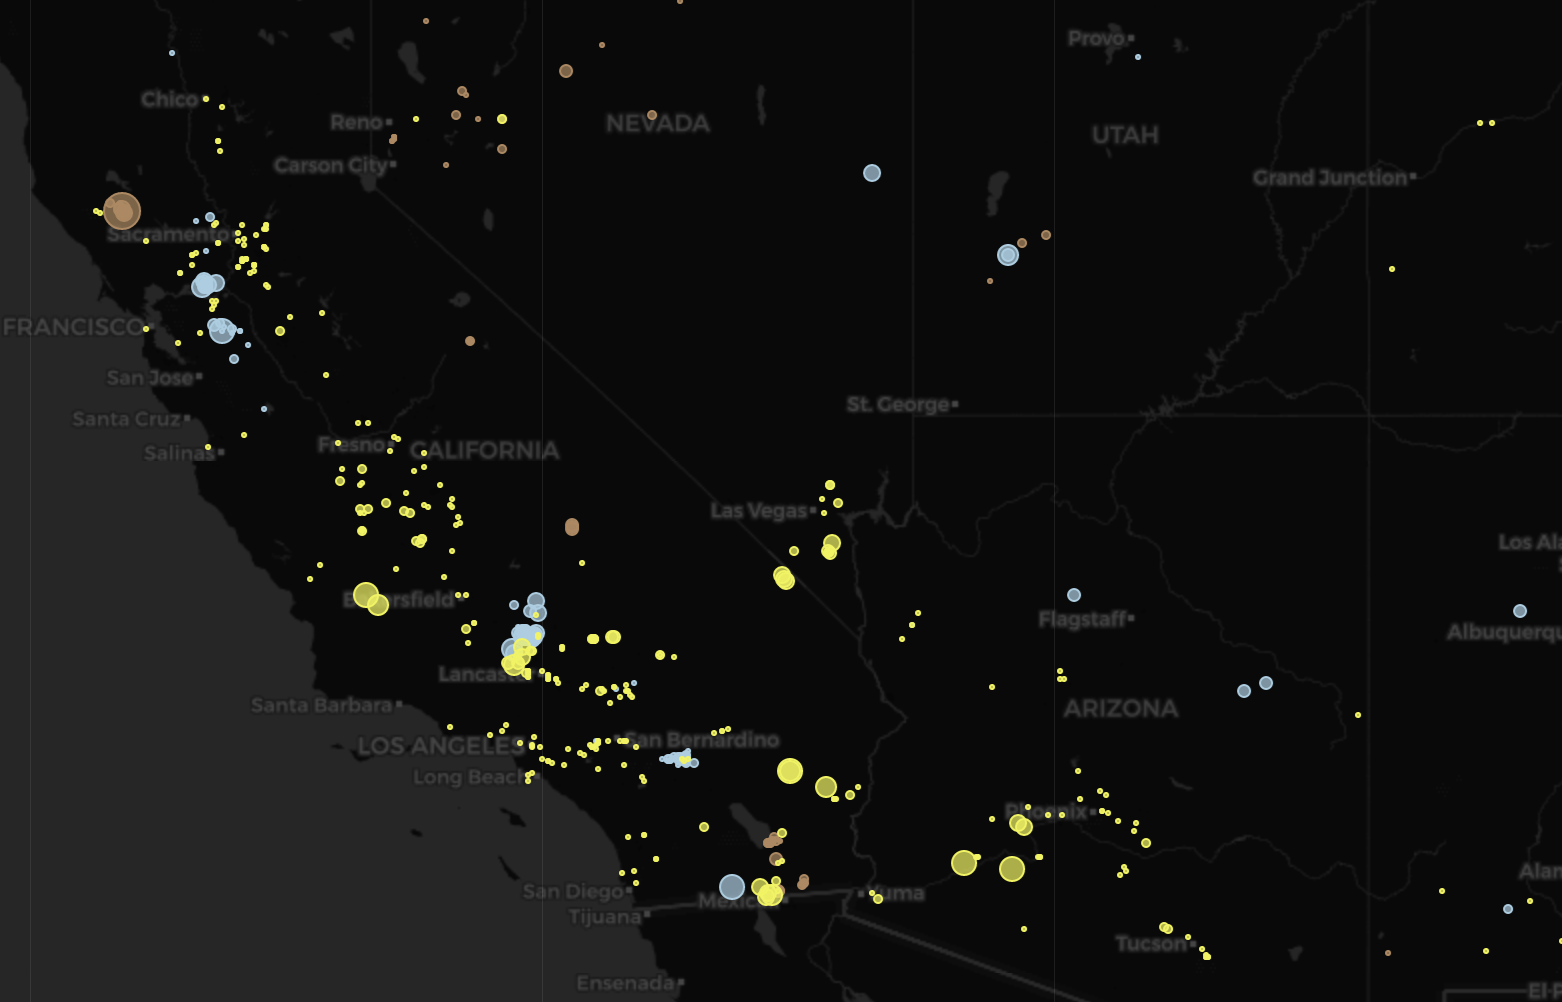
Renewable Energy Powerplants
This interactive web map shows power plants in the U.S. that generate electricity from wind, solar, and geothermal sources. It was created with Leaflet and Javascript using data sourced from the U.S. Energy Information Administration.
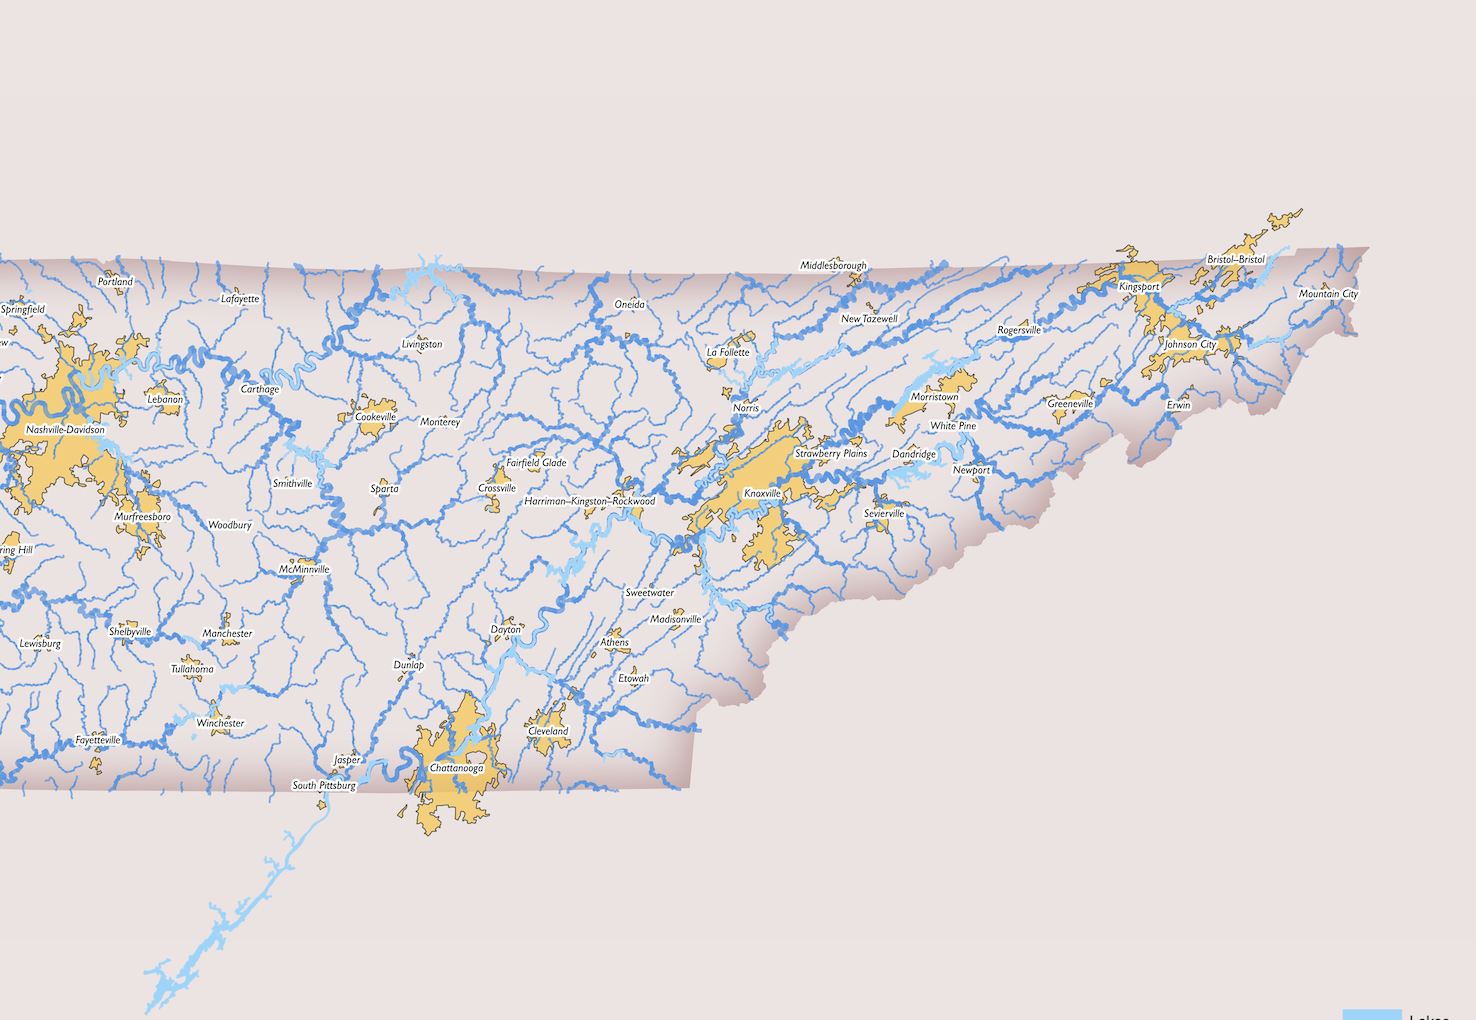
Waterways of Tennessee
This static map visualizes waterways in the state of Tennessee and was created with QGIS.